Prometheus介绍、安装和基本功能快速入门
#编程技术 2024-01-24 16:35:20 | 全文 2789 字,阅读约需 6 分钟 | 加载中... 次浏览👋 相关阅读
- 部署 Monit 来监控服务
- 使用acme.sh自动申请Let's Encrypt泛域名证书
- centos离线(内网环境无外网)安装docker
- Mysql8主从复制实现过程记录
- 纯绿色无需安装软件,10行代码即可长期关闭Windows系统更新
Prometheus 是一个开源的监控和报警系统,它将我们关心的指标值通过 PULL 的方式获取并存储为时间序列数据。
如果单从它的收集功能来讲,我们也可以通过 mysql、redis 等方式实现。然而,这些数据是在每时每刻产生的,其庞大的规模需要我们好好的考虑其存储方式。
另外,这些监控数据大多数时候是跟统计相关的,比如数据与时间的分布情况等,这需要有专业的度量知识。而这些正是 Prometheus 的擅长所在。由于 Prometheus 的关注重点在于指标值以及时间点这两个因素,所以外部程序对它的接入成本非常的低。这种易用性可以让我们对数据进行多维度、多角度的观察和分析,使得监控的效果更加具体化,例如内存消耗、网络利用率、请求连接数等。
除此之外,Prometheus 还具备了操作简单、可拓展的数据收集和强大的查询语言等特性,这些特性能帮助我们在问题出现的时候,快速告警并定位错误。所以现在很多微服务基础设施都会选择接入 Prometheus,像 k8s、云原生等。
Prometheus 基于 Golang 编写,编译后的软件包,不依赖于任何的第三方依赖。只需要下载对应平台的二进制包,解压并且添加基本的配置即可正常启动 Prometheus Server。
基本原理
整个 Prometheus 可以分为四大部分,分别是:
Prometheus 服务器
Prometheus Server 是 Prometheus 组件中的核心部分,负责实现对监控数据的获取,存储以及查询。
NodeExporter 业务数据源/Targets Discover
业务数据源通过 Pull/Push 两种方式推送数据到 Prometheus Server。
AlertManager 报警管理器
Prometheus 通过配置报警规则,如果符合报警规则,那么就将报警推送到 AlertManager,由其进行报警处理。
可视化监控界面
Prometheus 收集到数据之后,由 WebUI 界面进行可视化图标展示。目前我们可以通过自定义的 API 客户端进行调用数据展示,也可以直接使用 Grafana 解决方案来展示。
其它组件:
Pushgateway
为监控节点提供 Push 功能,再由 Prometheus server 到 Pushgateway 集中 Pull 数据。
PromQL
针对指标数据查询的语言,类似 SQL。
简单地说,Prometheus 的实现架构也并不复杂。其实就是收集数据、处理数据、可视化展示,再进行数据分析进行报警处理。但其珍贵之处在于提供了一整套可行的解决方案,并且形成了一整个生态,能够极大地降低我们的研发成本。
下面我们通过一个简单的例子来实现对服务器 CPU、内存等硬件信息的监控。
安装运行 Prometheus 服务端
Prometheus 服务端负责数据的收集,因此我们应该首先安装并运行 Prometheus Server。
从 https://prometheus.io/download/ 找到最新版本的 Prometheus Sevrer 软件包,比如下载 prometheus-2.49.1.linux-amd64.tar.gz 安装包,并上传到服务器
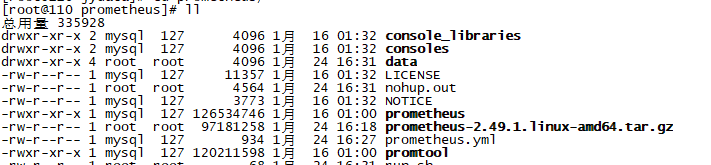
解压安装包,可以看到如下目录结构:
新建一个 data 目录,用来作为数据的存储路径,也可以通过运行时的 –storage.tsdb.path=“数据存放路径”
命令另行指定路径,如果不指定默认是 data 目录。
prometheus.yml 是 prometheus 的配置文件,prometheus 是运行的可执行文件。
启动 prometheus 服务,其会默认加载当前路径下的 prometheus.yaml 文件,当然我们也可以手动指定配置文件
地址:
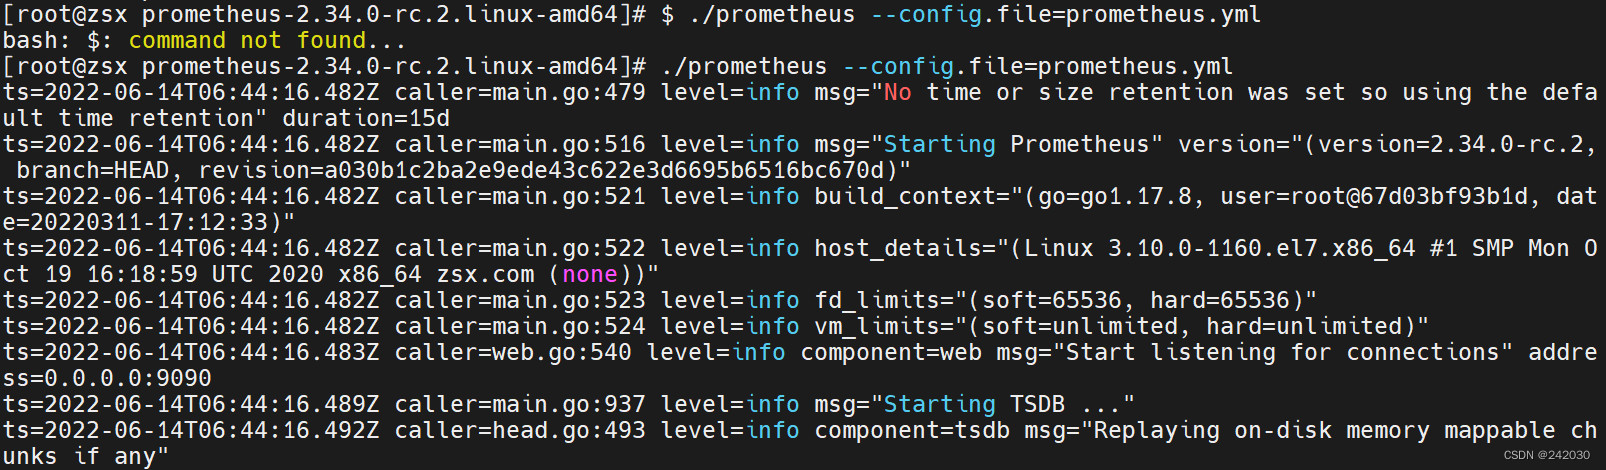
# 前台启动
./prometheus --config.file=prometheus.yml

# 后台启动
nohup ./prometheus --config.file=prometheus.yml >> nohup.out 2>&1 &
正常的情况下,你可以看到以下输出内容:
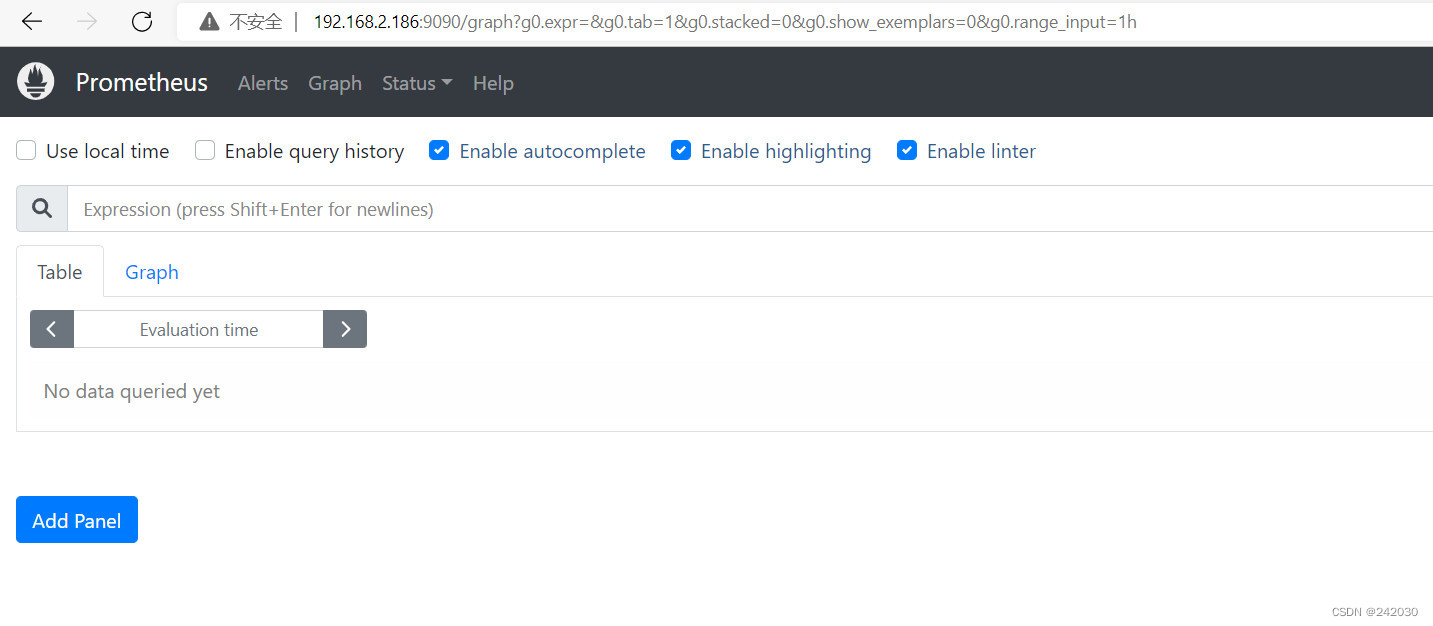
输入 http://你的服务器IP:9090/graph 通过浏览器进行访问
可以看到如下页面,这个是 Prometheus 自带的监控管理界面:
将 Prometheus 设置为服务
创建 service 并设置自动启动:
vi /usr/lib/systemd/system/prometheus.service
配置如下内容:
[Unit]
Description=prometheus
Documentation=https://prometheus.io/
After=network.target
[Service]
Type=simple
User=root
Group=root
ExecStart=/home/zhangshixing/prometheus/prometheus/prometheus --config.file=/home/zhangshixing/prometheus/prometheus/prometheus.yml
Restart=on-failure
[Install]
WantedBy=multi-user.target
设置自动启动:
systemctl enable prometheus
启动服务并查看启动状态:
# 重新加载某个服务的配置文件
$ systemctl daemon-reload

# 启动prometheus
$ systemctl start prometheus

# 查看prometheus状态
$ systemctl status prometheus
[root@zsx ~]# systemctl status prometheus
● prometheus.service - prometheus
   Loaded: loaded (/usr/lib/systemd/system/prometheus.service; enabled; vendor preset: disabled)
   Active: active (running) since Wed 2023-03-01 10:28:26 CST; 19s ago
     Docs: https://prometheus.io/
 Main PID: 108411 (prometheus)
    Tasks: 6
   Memory: 23.2M
   CGroup: /system.slice/prometheus.service
           └─108411 /home/zhangshixing/prometheus/prometheus/promet...

Mar 01 10:28:27 zsx.com prometheus[108411]: ts=2023-03-01T02:28:27.099Z caller=head.go:53…43µs
Mar 01 10:28:27 zsx.com prometheus[108411]: ts=2023-03-01T02:28:27.099Z caller=head.go:54...e"
Mar 01 10:28:27 zsx.com prometheus[108411]: ts=2023-03-01T02:28:27.107Z caller=tls_config...se
Mar 01 10:28:27 zsx.com prometheus[108411]: ts=2023-03-01T02:28:27.107Z caller=head.go:61...=0
Mar 01 10:28:27 zsx.com prometheus[108411]: ts=2023-03-01T02:28:27.107Z caller=head.go:61…55ms
Mar 01 10:28:27 zsx.com prometheus[108411]: ts=2023-03-01T02:28:27.111Z caller=main.go:95...IC
Mar 01 10:28:27 zsx.com prometheus[108411]: ts=2023-03-01T02:28:27.111Z caller=main.go:96...d"
Mar 01 10:28:27 zsx.com prometheus[108411]: ts=2023-03-01T02:28:27.111Z caller=main.go:11...ml
Mar 01 10:28:27 zsx.com prometheus[108411]: ts=2023-03-01T02:28:27.497Z caller=main.go:1179…µs
Mar 01 10:28:27 zsx.com prometheus[108411]: ts=2023-03-01T02:28:27.498Z caller=main.go:91...."
Hint: Some lines were ellipsized, use -l to show in full.
其它的服务都类似,只需要修改相应 service 文件的一些参数。
运行 NodeExporter 客户端
NodeExporter 是 Prometheus 提供的一个可以采集到主机信息的应用程序,它能采集到机器的 CPU、内存、磁盘等信息。
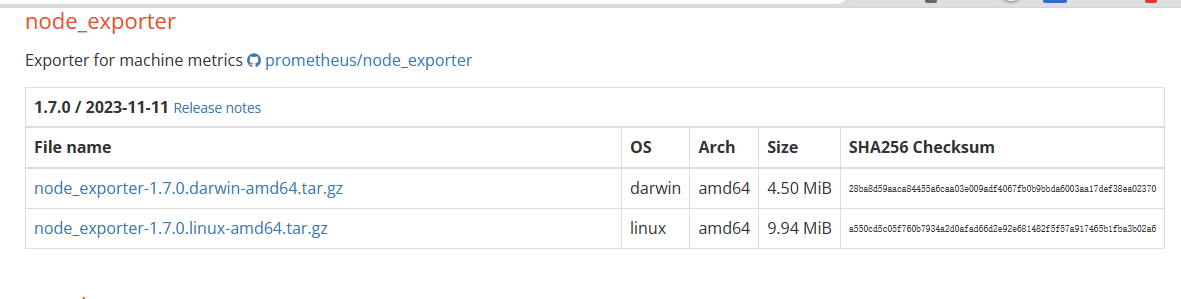
我们从 https://prometheus.io/download/#node_exporter 获取最新的 Node Exporter 版本的二进制包:
下载、上传、解压一条龙操作
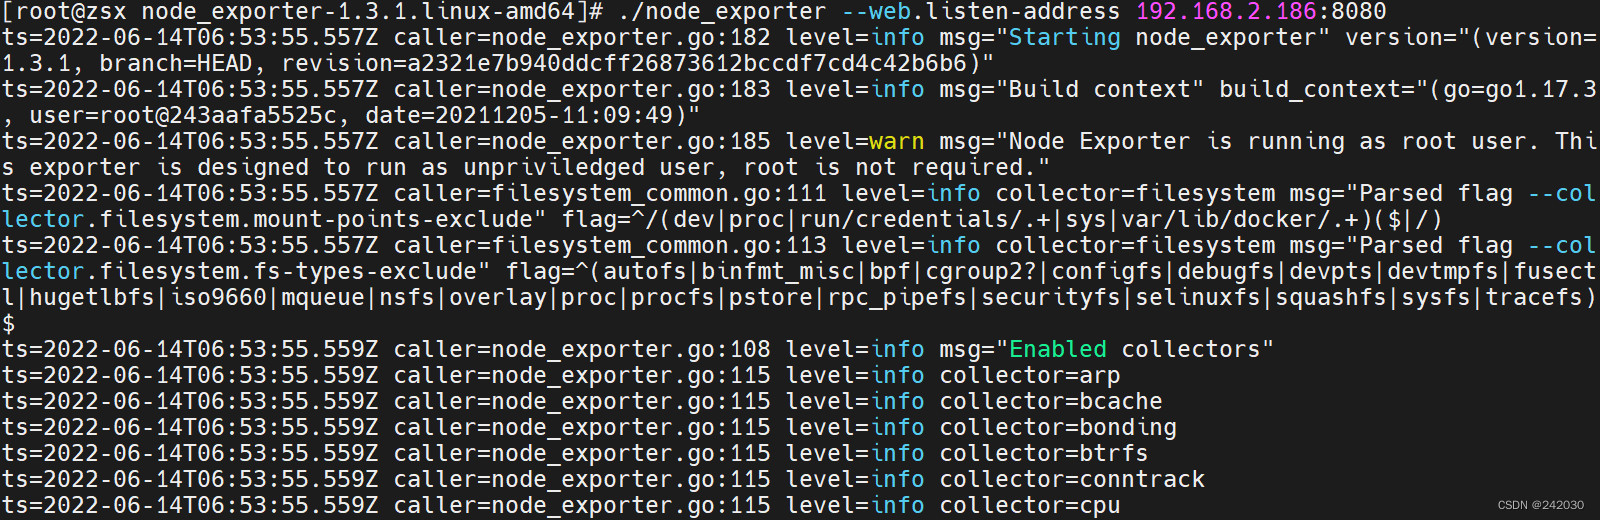
然后运行 Node Exporter,我们指定用 8080 端口运行:
# 前台运行
./node_exporter --web.listen-address 0.0.0.0:8080

# 后台运行
nohup ./node_exporter --web.listen-address 0.0.0.0:8080 >> nohup.out 2>&1 &
启动成功后,可以看到以下输出:
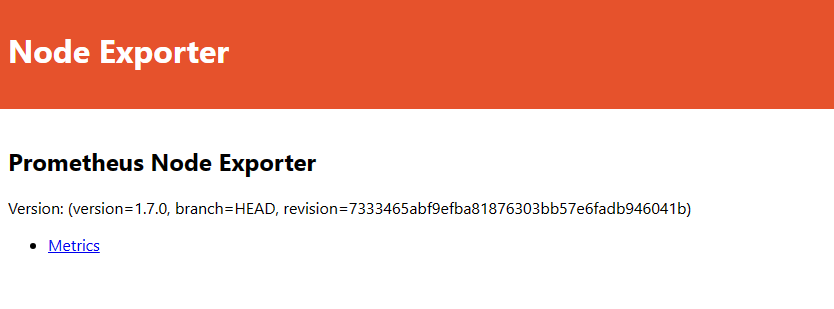
访问 http://你的服务器IP:8080/
访问 http://你的服务器IP/metrics ,可以看到当前 node exporter 获取到的当前主机的所有监控数据,如下所示:
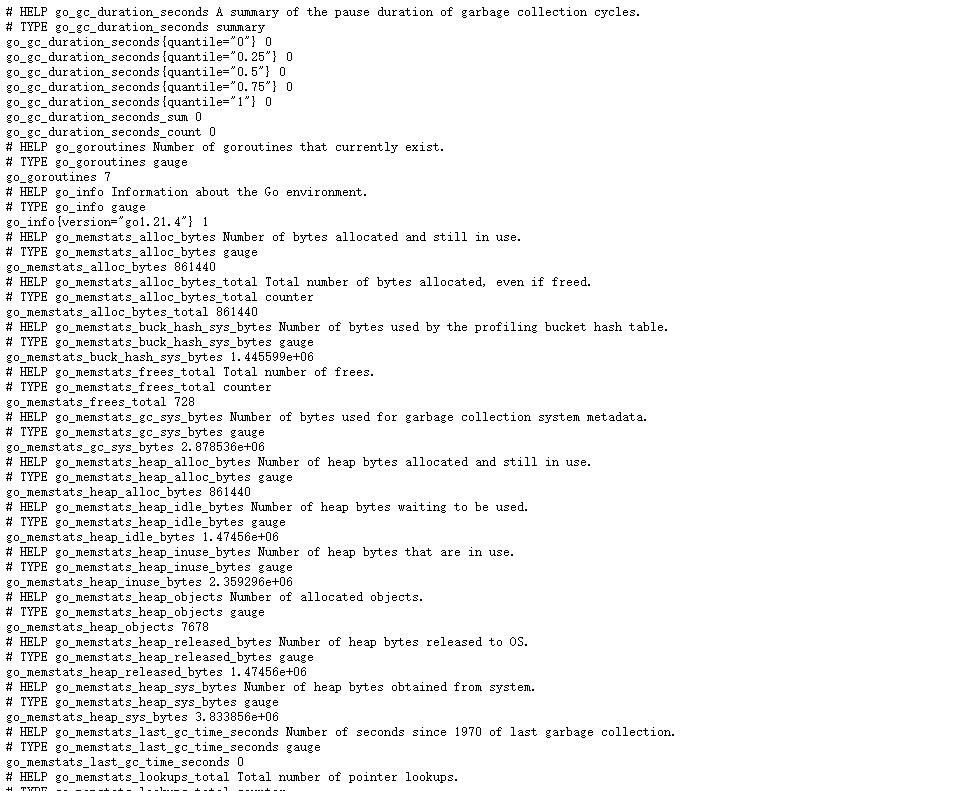
每一个监控指标之前都会有一段类似于如下形式的信息:
# HELP node_cpu_guest_seconds_total Seconds the CPUs spent in guests (VMs) for each mode.
# TYPE node_cpu_guest_seconds_total counter
node_cpu_guest_seconds_total{cpu="0",mode="nice"} 0
node_cpu_guest_seconds_total{cpu="0",mode="user"} 0
其中 HELP 用于解释当前指标的含义,TYPE 则说明当前指标的数据类型,node_cpu_guest_seconds_total 为监控的具体指标。
除了这些以外,在当前页面中根据物理主机系统的不同,你还可能看到其它的一些监控指标。
配置 Prometheus 的监控数据源
现在我们运行了 Prometheus 服务器,也运行了业务数据源 NodeExporter。但此时 Prometheus 还获取不到任何数据,我们还需要配置下 prometheus.yml 文件,让其去拉取 Node Exporter 的数据。
我们配置一下 Prometheus 的配置文件,让 Prometheus 服务器定时去业务数据源拉取数据。编辑 prometheus.yml 并在 scrape_configs 节点下添加以下内容:
scrape_configs:
  - job_name: 'prometheus'
    static_configs:
      - targets: ['localhost:9090']
  # 采集node exporter监控数据
  - job_name: 'node'
    static_configs:
      - targets: ['localhost:8080']
上面配置文件配置了两个任务。一个是名为 prometheus 的任务,其从「 localhost:9090 」地址读取数据。另一个是名为 node 的任务,其从「 localhost:8080 」地址读取数据。
备注:每次修改配置完成,用 promtool 检测配置文件是否正确
./promtool check config ./prometheus.yml

配置完成后,我们重新启动 Prometheus。
systemctl restart prometheus
配置 Mysql 监控
监控 mysql 需要在被监控机器安装 mysql_exporter
mysql_exporter 下载地址:https://prometheus.io/download/#mysqld_exporter
上传解压安装 mysqld_exporter
解压后进入目录,创建 my.cnf 配置文件
vi my.cnf
将数据库连接信息写入
[client]
host=127.0.0.1
port=3306
user=mysql_monitor
password=12345678
运行 mysqld_exporter
./mysqld_exporter --config.my-cnf=my.cnf

# 后台运行
nohup ./mysqld_exporter --config.my-cnf=my.cnf >> nohup.out 2>&1 &
配置 Prometheus 获取监控数据
Prometheus 添加 job_name:mysql_exporter
  - job_name: "mysqld_exporter_155"
    static_configs:
      - targets: ['127.0.0.1:9104']
配置完之后用上边的方法检查一下配置是否正确,没问题重启 Prometheus 即可
查询监控数据
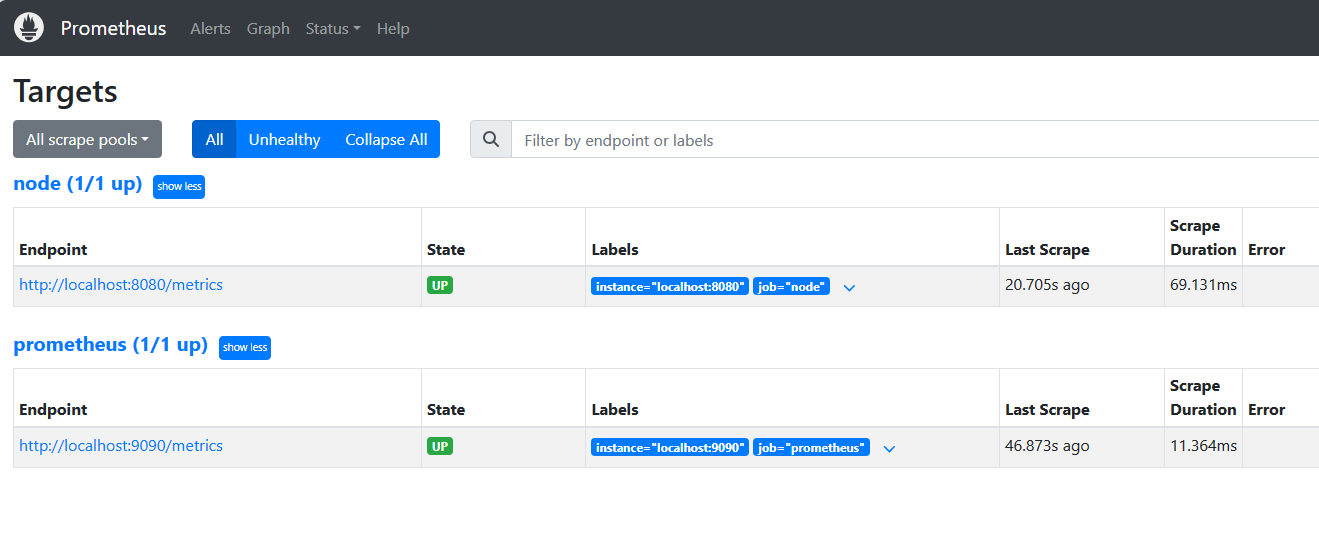
配置完 Prometheus 读取的数据源之后,Prometheus 便可以从 Node Exporter 获取到数据了。那么接下来我们如何查看到这些数据呢?答案是:Prometheus UI!
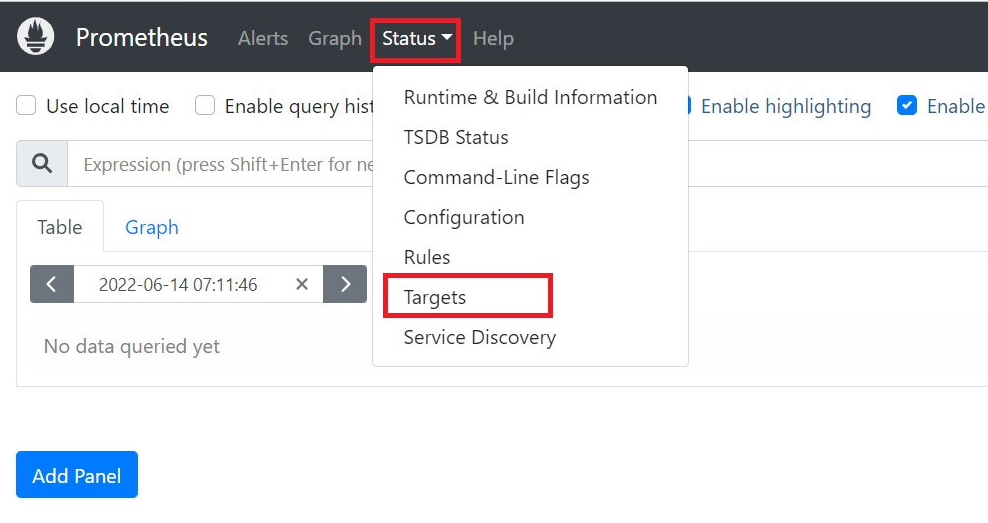
Prometheus UI 是 Prometheus 内置的一个可视化管理界面,我们通过 http://你的服务器IP:9090 就可以访问到该页面。
通过 Prometheus UI 可以查询 Prometheus 收集到的数据,而 Prometheus 定义了 PromQL 语言来作为查询监控数据的语言,其与 SQL 类似。
接下来我们访问 http://你的服务器IP:9090 ,进入到 Prometheus Server。如果输入「up」并且点击执行按钮以后,可以看到如下结果:
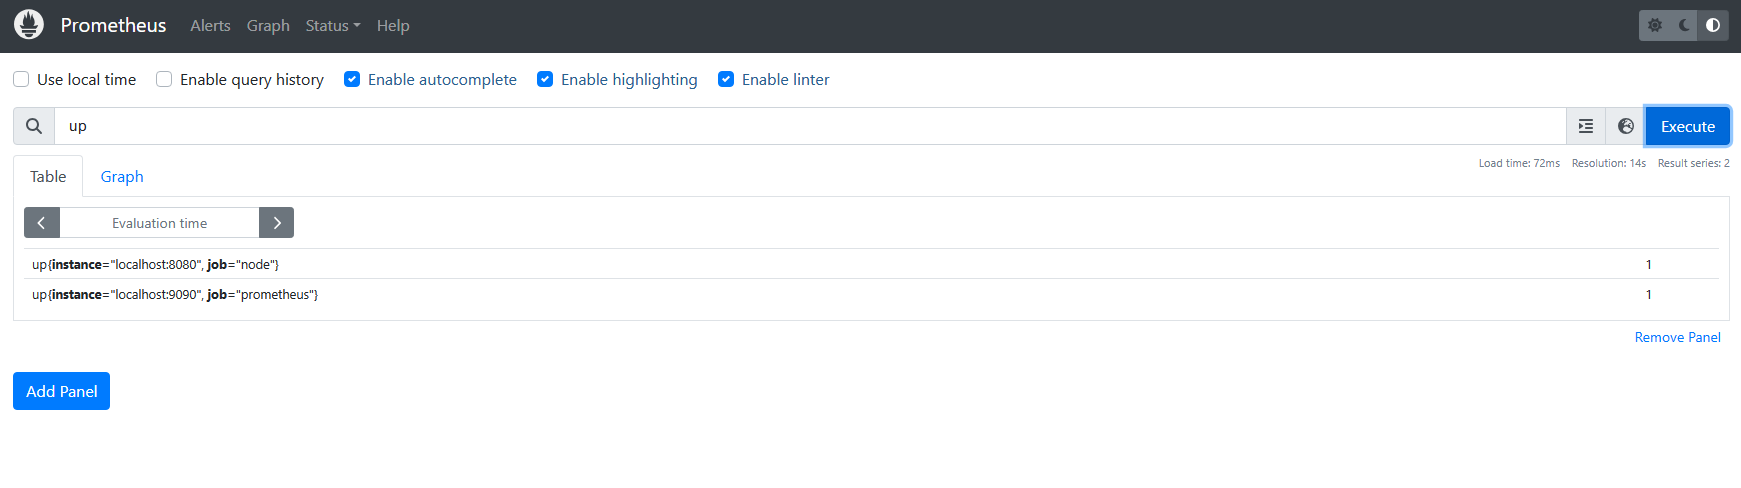
可以看到有几条记录,其中 instance 值为 localhost:8080 的记录,value 是 1,这代表对应应用是存活状态。
up{instance="192.168.2.186:8080", job="node"} 1
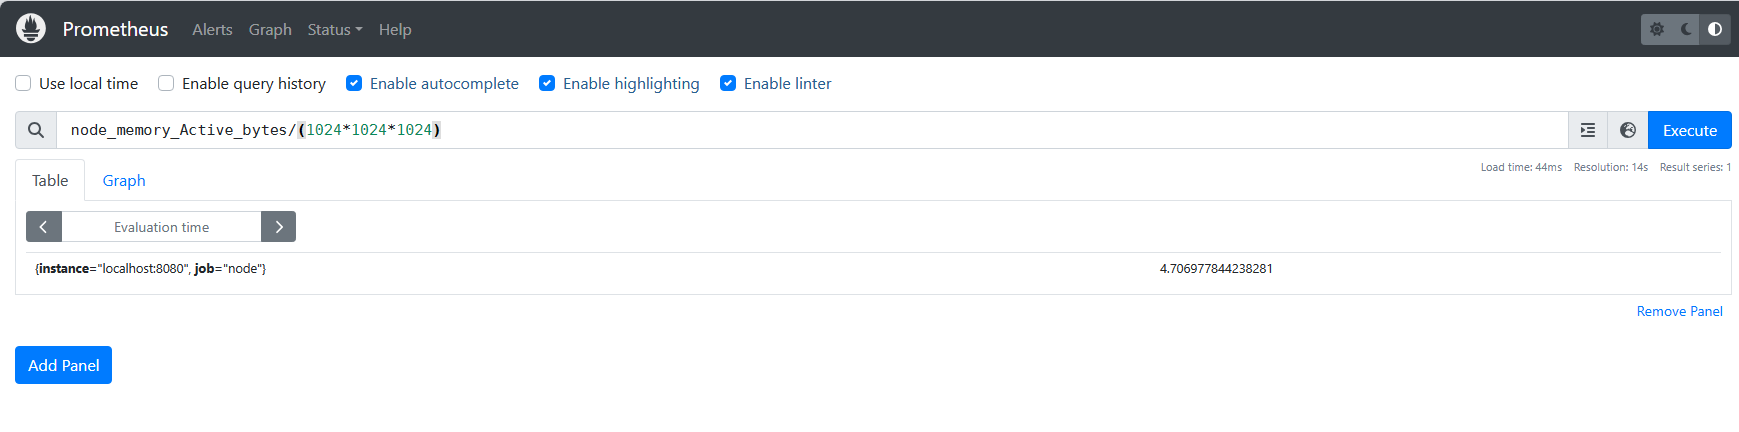
例如查看我们所运行 NodeExporter 节点所在机器的内存使用情况,可以输入
node_memory_Active_bytes/(1024*1024*1024)
到这里,我们基本上为完成了数据的收集过程,即数据从业务侧收集到 Prometheus 侧,并且还学会了如何使用 Prometheus 自带的控制台。
VIA
Prometheus介绍安装和快速入门_promethusan安装-CSDN博客 https://blog.csdn.net/qq_30614345/article/details/131257074